Dan Manastireanu
May 8, 2025
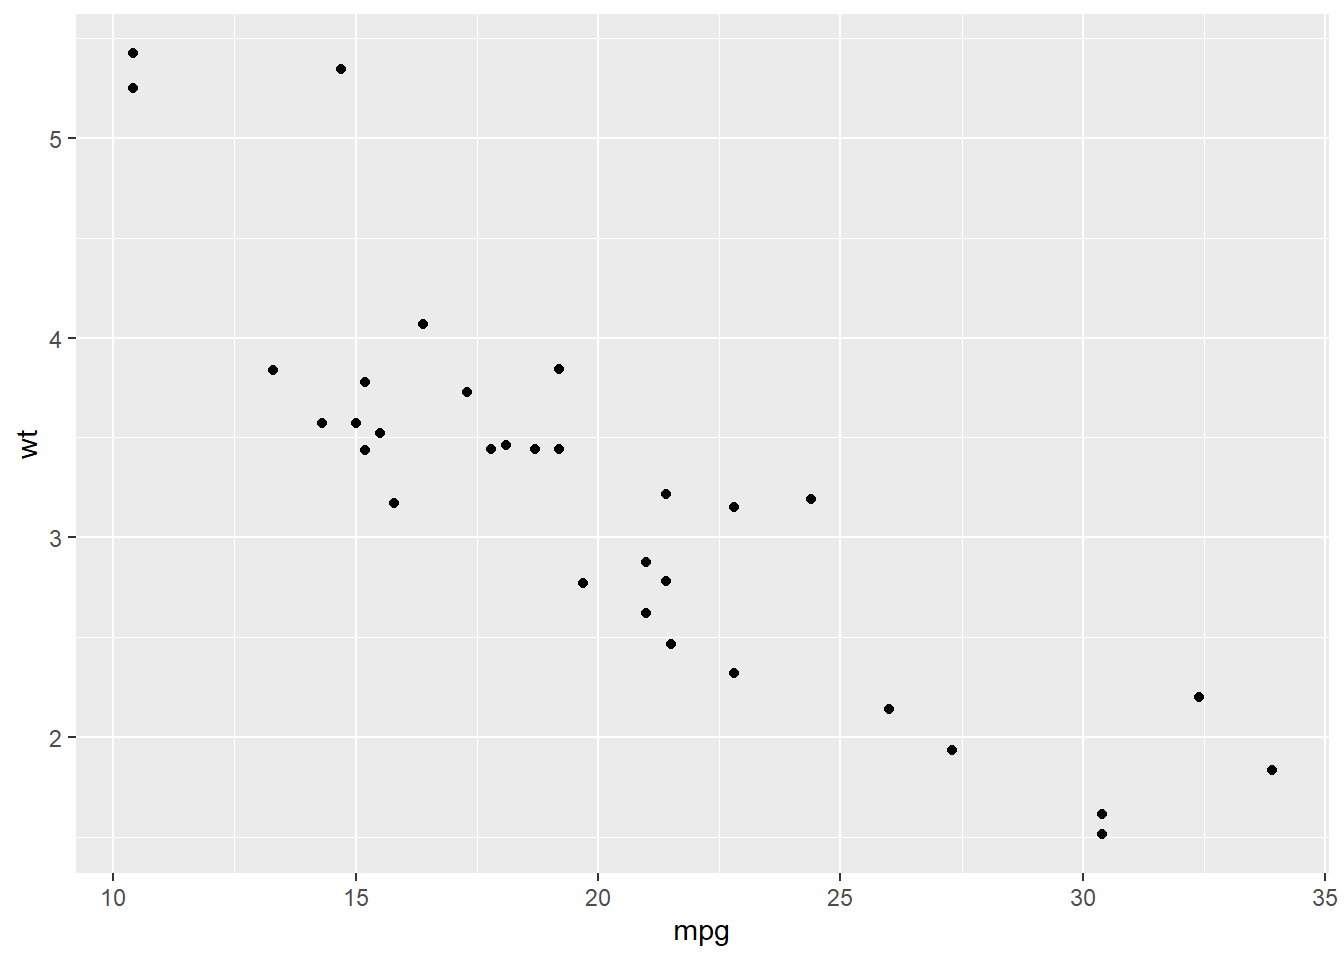
Here is the code:
library(ggplot2)

ggplot(mtcars, aes(mpg, wt)) +geom_point()
and the rest of the text …